The statistical model Logistic regression is a classification technique used to predict a concrete class of the target variable. It is used to assign the target variables to a certain class by calculating probability based on the analysis of the given observations. Most commonly the target variables are of binary nature here, which means based on the available observations the target variable can be classified as either 1(true) or 0(false). However, the technique can be extended to assign a variable to one of the more than two classes by calculating its probability of belonging to the individual class between 0 and 1 and all those probabilities summing up to 1.
Examples and applications of Logistic Regression:
The logistic regression technique is applied in various machine learning algorithms that deal with classification problems. The most common applications would be in the fields of healthcare, crime detections, marketing, image processing, etc. For example, if a patient is positive for some disease or not, if the signature of the person is valid or not, an animal belongs to one class of species or not, and many such problems that can be answered in yes/true or no/false. As discussed above, it can also be extended to model several classes of events such as determining whether an image contains a truck, a car, or a bus, and so on.
Types of logistic regression:
Depending upon the number and nature of the models to which target variables can be classified, logistic regression can be classified into the following types:
- Binary: The target variables can be classified as either 1 or 0
- Multinomial: The target variable can be classified into three or more possible unordered types. The types here are unordered i.e. independent of each other and the probability of a variable belonging to any one of them is not influenced by its probability of belonging to others. E.g. depending upon the characteristics of a vehicle it can be classified into any one of the vehicle types such as a truck, car, or bus.
- Ordinal: The target variable can be classified into three or more possible ordered types. The types here are ordered. The types here have a proportional relationship with each other. E.g. when we are dealing with classifying or ranking a student, not in terms of number but in terms of relative categories such as novice, intermediate, or proficient, the probability of a target variable to classified in one of the types is the cumulative probability of it being qualified for all the previous categories as well in the ordered list.
Learning logistic regression:
Linear regression exhibits a continuous outcome whereas logistic regression assigns the target variable to a discrete class. Linear regression would exhibit a continuous outcome in case of predicting weather of a geographical region that will vary depending on the values of humidity and air pressure there. On the other hand, logistic regression would exhibit a discrete( in this case Boolean outcome) such as whether it will rain there or not depending upon the threshold value of the predictions.
Logistic regression uses the logistic function, aka the Sigmoid function to predict the specific outcome based on the predictions generated from the known variables. The sigmoid function is an S-shaped curve that takes a real number and map it into a value between 0 and 1. It further returns a discrete value of 0 or 1 by comparing the previous mapped value with some threshold value.
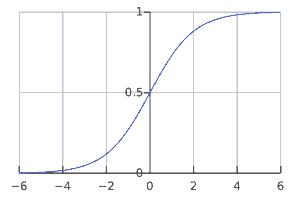
Let us take an example of using a sigmoid function to classify a vehicle like a bus or a car. Based on the input features of a vehicle the prediction function would return a probability between 0 and 1 for it being a car or a bus. As shown in the diagram, we are taking 0.5 as a threshold, so for a probability value of anything greater than 0.5, say 0.7, the sigmoid function would classify the vehicle as a Car(1), and accordingly, it would classify the vehicle as a Bus(0) for a probability value less of 0.3.
The sigmoid function can be represented as:
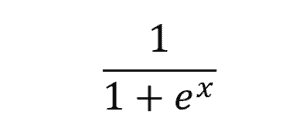
Here, e is the base of natural logarithms and x is the numerical variable value that needs to be transformed to get the predicted variable.
Representing logistic regression:
The equation of the logistic regression takes this form:
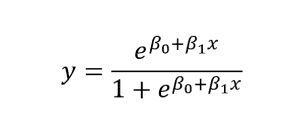
Here, is the value to be predicted, is the intercept, and is the coefficient of the input value.
By comparing the predicted value, with the threshold fixed for the model, we can estimate the probability and classify the input value into the appropriate class.
Maximizing accuracy of logistic regression:
The accuracy of the logistic regression is maximized by minimizing the errors in the estimation of coefficients ( values) from the training data. The errors can be minimized by using the Maximum likelihood estimation algorithm.
The most accurate coefficient values would enable the logistic regression model to minimize the errors in the probability calculation and to predict the output values that are almost accurate or are very close to the classification boundary.
When to use logistic regression?
Logistic regression would work the best when we have a large sample size to train the model and when we want to predict the discrete categories of the target variable.
The variables in the model should be meaningful in a way that there is a direct and predictable correlation between them.
The multi-collinearity between the variables would result in an inaccurate prediction. Logistic regression is very simple to train. It can be used as a benchmark to measure the performance of other complex algorithms.
Like any other classification model, the logistic regression model also works best on the training data that is cleaned from possible outliers and misclassification prone variables.
Logistic regression is highly dependent on the underlying data and relationships between them. It cannot be used in scenarios where we need to perform continuous values prediction and not discrete classification. The model would not work in a case where the relationship between the target and dependent variable is non-linear in nature as the model is based on a discrete threshold value.
In this article, I have explained the logistic regression model and its working strategy. I have discussed the types of logistic regression, its mathematical deductions, and usage scenarios. This will help you understand the model better and identify the areas of application for the same.
Thank you for reading. We hope this gives you a brief understanding of the latest news. Are you interested read about other latest articles on Machine Learning and Data Science? Explore our Technology blogs for more.


